Why isn’t it charging?
A 170 amp machine is charging at 40 amps. Why?
Modern regulators interpret a dozen+ limits at any given time. The lowest of the bunch (or the physical limit of something in the system) defines the output. Those limits can be derived internally (normal control loops, safeties), or externally from smart networks, especially in more advanced systems, which can get complicated quickly.
This variety of limits makes it impossible to answer our question with only the usual digital ammeter display and current vs. time plot. 40 amps might be a temperature derate doing its job, abnormal belt slippage, degraded brushes, a battery that says it’s full, or even a programming bug. Same reading, five different causes, and a different correct response to each.
XREG-010 shows which limit is binding
X Engineering’s answer is below. Select a condition from the menu and watch the App display respond:
Four of the labels open a detail popup: Batt volts, Alt amps, Batt amps, Alt temperature. So do the field-drive percentage and the status words beside them. What comes up is the limiting factor, the active limit value, and where that gets set. The last one saves a lot of time in a complex interface.
Try it out!
As of this writing, there are fifteen different reasons XREG-010 charging can be reduced, and twenty-six reasons it can stop altogether. Each is clickable and will display the corresponding popup:
One in particular, according to a scrape of internet forums, seems to generate the most wasted time for owners, technicians, and OEM tech support. If a BMS or gateway such as a Victron Cerbo GX is publishing charge limits on the network, and the regulator is set to follow them, then the number in charge is not the regulator’s. That setting is a ceiling only: the regulator’s own settings still apply whenever they ask for less, but raising them past the external limit does nothing and has historically been pretty confusing.
Physical anomalies
The banner described so far does not identify physical issues; for that the regulator needs something else. A slipping belt, a corroded crimp, or an alternator losing diodes all show up as field high, yet low output. So it adds a second test: performance now against this same alternator’s own past.
Short- and long-term trends
During operation, when engine speed, field drive, bus voltage, alternator temperature, and the output current all hold steady for long enough, the regulator logs what the alternator produced at this operating point. A run is written down only when it beats what is already on the books for those conditions. What builds up over time is therefore a record of bests: the most this machine has ever managed at each operating point.
A single value, Charging System Health, is today’s output as a percentage of the “best ever” for similar conditions. Both sides of the comparison are the same statistic, a sustained multi-second average. A momentary dip therefore doesn’t read as lost health. MEASURED means a recorded best exists at this operating point. ESTIMATED means it was interpolated from trustworthy neighbors. When the surrounding data is too one-sided to grade fairly, no number shows up. The system is tuned to balance sufficient data entry with outlier elimination, set by the factory but user-adjustable. A detail page on that tuning is coming soon.
That percentage rides in the same banner beside the rest of the readings, and an additional plot is available in the Live Data → Diag tab:
This Session
Sample data. Forty-five minutes exported from the bench regulator. Fifty-eight graded points, mean 100%, tenth percentile 99%. The plot shows the last thirty minutes; the empty stretch on the left is a period it declined to grade (system still learning/unsteady conditions).
The plot above drops a point every five seconds, whenever conditions are steady enough to grade. A second intake takes one graded sample every ten seconds and sorts it into engine-hour buckets. Each bucket keeps that hour’s average and its low tenth percentile, and the buckets are the long term health trend:
Charging System Health vs Engine Hours
A healthy charging system holds a roughly flat line near 100. The darker line is each hour’s low 10% mark: a tenth of that hour’s readings fell below it.
Waveform diagnostics
There is a third layer in development as well. The regulator samples alternator output current at 20 kHz. That is fast enough to see the rectifier ripple, pulse by pulse. The development system works like the one above: it compares “now” against reference behavior from the past. In this case it’s a visual flipbook, where the operator can scroll through waveforms from each 1000 rpm band, and compare them side by side to “reference”. This is diagnostic only and currently plays no part in regulation.
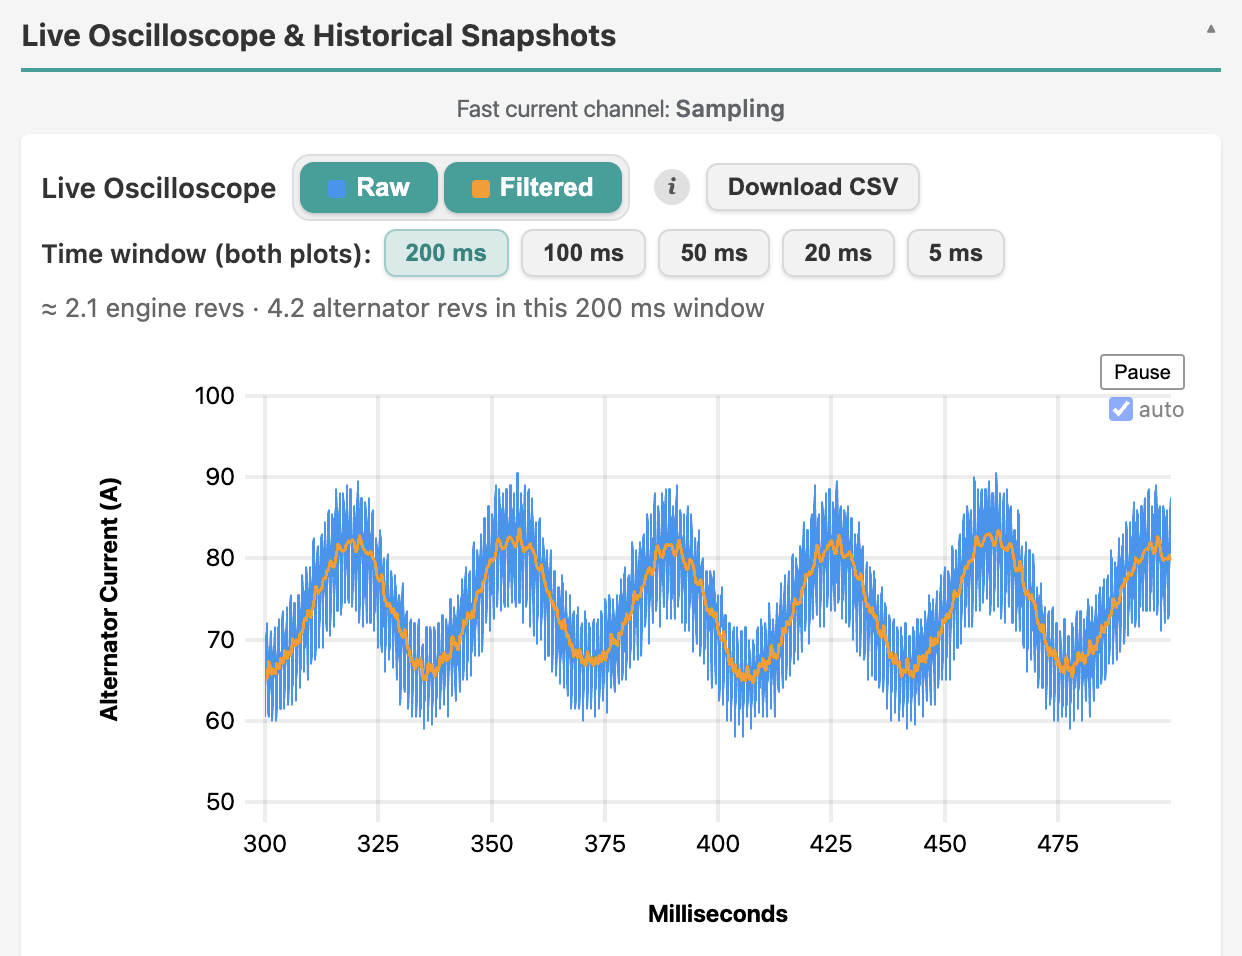
In the background, a rectifier fault classifier analyzes two-second windows of the raw stream. That work runs on the regulator’s extra CPU core, where it can never hold up the control loop. Four verdicts are possible: quiet, healthy, trending, fault. On a fault the classifier goes one step further and tells a diode-class pattern from a phase-class one by the way the crest train repeats. The waveform is then filed into the flipbook at its own engine speed. The bad page lands beside the good one, and the fault counter behind it survives a reboot.
So far this has only been tested on modeled faults. Real fleet waveforms will sharpen both the warnings and the diagnosis.
Mark Nickerson
X Engineering
September 8, 2026